

The top 10 most dangerous cities in the U.S. can be ranked from public data rather than opinion, and this article does exactly that. It uses the FBI’s 2025 crime figures for the 50 largest cities, counted per 100,000 residents so that a big city is not penalized simply for having more people.
The short answer: ten cities top the 2025 ranking, from Denver at number 10 to a number one that we reveal at the end of the countdown. Each city is ranked by its total crime rate, which adds violent crime and property crime together.
This is the written companion to our video of the same name. Watch it below, read the details, or do both.
How this list of the most dangerous cities in the U.S. is ranked
The figures come from the FBI’s Crime in the United States report for 2025, as compiled and ranked by Security.org. The analysis covers the 50 largest U.S. cities within their city limits, using Census Bureau provisional population estimates for July 1, 2025.
Cities are ranked by total crime rate, which is the violent crime rate plus the property crime rate, each measured per 100,000 residents. Violent crime means murder and nonnegligent manslaughter, rape, robbery and aggravated assault. Property crime means burglary, larceny-theft and motor vehicle theft. Because every rate is divided by population, this is a most dangerous cities in the U.S. per capita list, and a city with more residents is not boosted for its size alone.
The national averages for 2025 are 327.6 violent crimes and 1,534.8 property crimes per 100,000 people, or 1,862.4 in total. Every comparison below is measured against those figures. We checked the violent crime rates against a second published analysis of the same FBI data, from Eufy, and the figures for Memphis, Detroit, Oakland, Kansas City, Baltimore and Minneapolis matched exactly.
One caution before the countdown. “Dangerous” here is shorthand for a high rate of reported crime across an entire city. It does not describe any single neighborhood, and it does not measure how likely any one person is to become a victim.
The 10 most dangerous cities in the U.S., from number 10 to number 6
10. Denver, Colorado
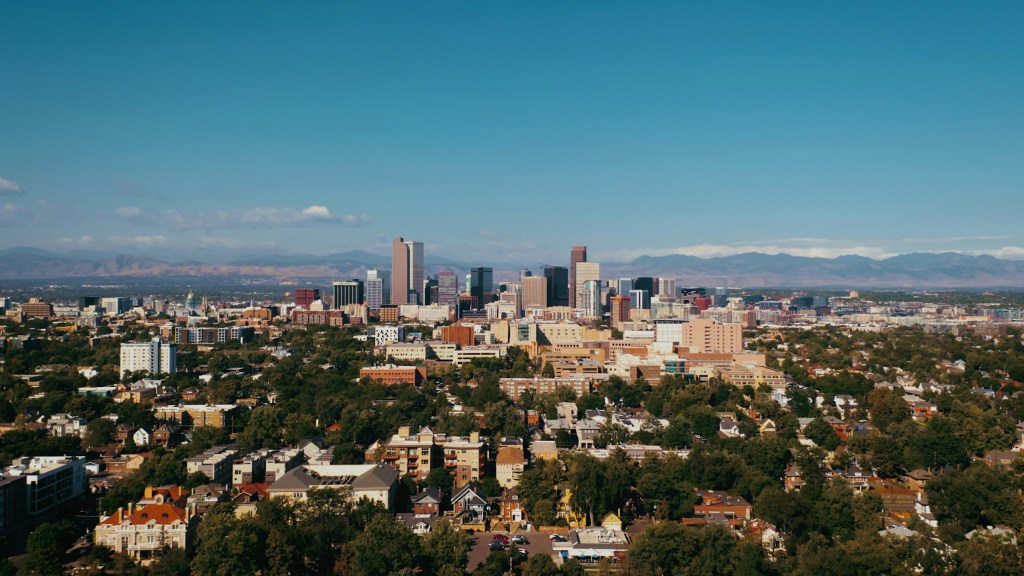
Denver closes the list with a total crime rate of 4,979.2 per 100,000 residents, about 2.7 times the national total. Its violent crime rate is 875.7 and its property crime rate is 4,103.5, and both sit at roughly 2.7 times the national averages. Denver is the most evenly balanced city on the list, with violent and property crime running at almost the same multiple of the national rate.
9. Seattle, Washington

Seattle records a total rate of 5,118.2. Its violent crime rate of 698.7 is about 2.1 times the national average, but its property crime rate of 4,419.6 is about 2.9 times higher. Roughly 86 percent of Seattle’s total comes from property offenses, and Security.org ranks the city fifth among the 50 largest for property crime.
8. Philadelphia, Pennsylvania

Philadelphia’s total crime rate is 5,130.1, with a violent rate of 822.7 (about 2.5 times the national average) and a property rate of 4,307.4 (about 2.8 times). About 84 percent of its total is property crime, and Security.org places the city sixth of the 50 for property offenses. Philadelphia sits only 11.9 points above Seattle, one of the closest margins in the ranking.
7. Kansas City, Missouri

Kansas City’s total rate is 5,319.5. This is the first city in the countdown where violent crime is the stronger signal: its violent rate of 1,369.4 is more than four times the national average, while its property rate of 3,950.1 is about 2.6 times the national figure.
6. Baltimore, Maryland

Baltimore’s total rate is 5,328.3, which places it fewer than 9 points above Kansas City. Its violent crime rate is 1,346.5, about 4.1 times the national average, and its property crime rate is 3,981.8, about 2.6 times. The two cities are almost identical in total, yet they are separated by a full place in the rankings.
The top 5 most dangerous cities in the U.S.
Five cities down and five to go. The totals from here are all above 5,400 per 100,000 residents, and the gaps between places begin to widen.
5. Minneapolis, Minnesota

Minneapolis has a total rate of 5,486.0. Its violent crime rate is 1,001.0, about 3.1 times the national average, and its property crime rate is 4,484.9, about 2.9 times. Both figures sit well above the national numbers without leading the list in either category.
4. Detroit, Michigan
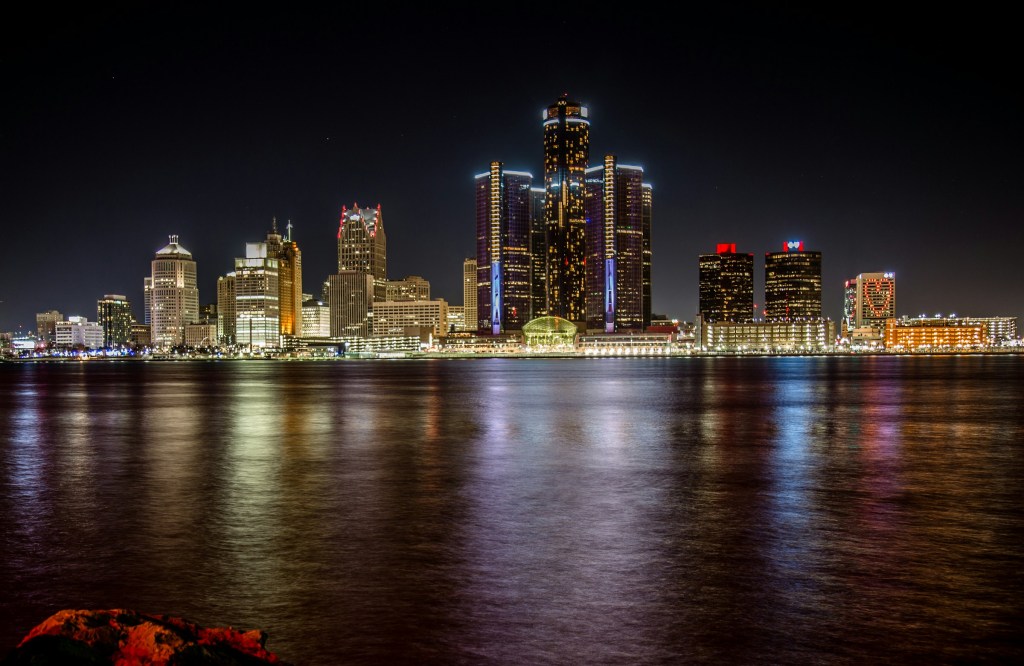
Detroit’s total rate is 5,531.4, and it is a violent crime story. Its violent rate of 1,649.1 is about 5.0 times the national average and the second highest of the ten cities. Its property rate of 3,882.2 is the lowest on the entire list, which shows how differently the same total can be built.
3. Portland, Oregon

Portland is the surprise of the countdown. Its violent crime rate of 694.6 is the lowest of the ten cities, about 2.1 times the national average. What lifts it to number three is property crime: its rate of 5,036.7 is about 3.3 times the national figure, and Security.org ranks it second among the 50 largest cities. About 88 percent of Portland’s total of 5,731.3 is property crime, so a high ranking on this list does not always mean a high level of violence.
2. Oakland, California
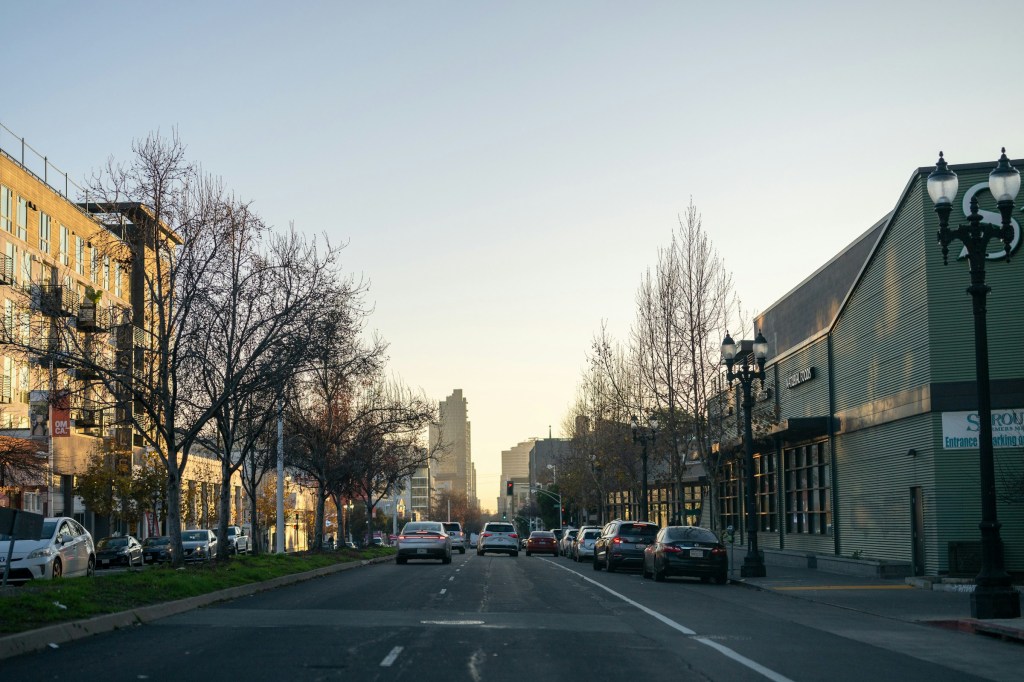
Oakland’s total rate is 6,700.9, nearly 970 points above Portland, the largest gap between any two neighboring cities on the list. It combines a violent crime rate of 1,475.4 (about 4.5 times the national average) with a property crime rate of 5,225.4 (about 3.4 times), the highest property rate of the ten.
1. Memphis, Tennessee

Memphis takes the top spot with a total crime rate of 6,816.7 per 100,000 residents, about 3.7 times the national total. Its violent crime rate of 1,849.4 is about 5.6 times the national average and the highest of the ten cities, and its property crime rate of 4,967.3 is about 3.2 times the national figure. The lead is narrow: Memphis finishes only 115.8 points ahead of Oakland, a margin of less than two percent.
The full ranking at a glance
Here is the complete list of the most dangerous cities in the U.S. ranked, with every rate expressed per 100,000 residents. The national averages are 1,862.4 total, 327.6 violent and 1,534.8 property.
| Rank | City | Total crime rate | Violent crime rate | Property crime rate |
|---|---|---|---|---|
| 1 | Memphis, Tennessee | 6,816.7 | 1,849.4 | 4,967.3 |
| 2 | Oakland, California | 6,700.9 | 1,475.4 | 5,225.4 |
| 3 | Portland, Oregon | 5,731.3 | 694.6 | 5,036.7 |
| 4 | Detroit, Michigan | 5,531.4 | 1,649.1 | 3,882.2 |
| 5 | Minneapolis, Minnesota | 5,486.0 | 1,001.0 | 4,484.9 |
| 6 | Baltimore, Maryland | 5,328.3 | 1,346.5 | 3,981.8 |
| 7 | Kansas City, Missouri | 5,319.5 | 1,369.4 | 3,950.1 |
| 8 | Philadelphia, Pennsylvania | 5,130.1 | 822.7 | 4,307.4 |
| 9 | Seattle, Washington | 5,118.2 | 698.7 | 4,419.6 |
| 10 | Denver, Colorado | 4,979.2 | 875.7 | 4,103.5 |
The order changes if you rank by violent crime alone. Among these ten cities, the five highest violent crime rates belong to Memphis, Detroit, Oakland, Kansas City and Baltimore, while Portland and Seattle have the lowest.
Frequently asked questions
What are the most dangerous cities in the U.S.?
Based on the FBI’s 2025 data for the 50 largest cities, ranked by total crime rate, the top five are Memphis, Oakland, Portland, Detroit and Minneapolis. Baltimore, Kansas City, Philadelphia, Seattle and Denver complete the top 10.
How is a most dangerous cities ranking calculated?
This one adds each city’s violent crime rate and property crime rate, both counted per 100,000 residents. Because property crimes are far more numerous than violent crimes, they carry a lot of weight in the total. That is why Portland ranks third despite having the lowest violent crime rate of the ten.
Does a high crime rate mean the whole city is dangerous?
No. A citywide rate is an average across every neighborhood, and it counts only crimes that were reported. It says little about any one street, and it does not predict what will happen to an individual resident or visitor.
Will the ranking change next year?
It can. A crime rate is a snapshot of one year of reporting, and several places in this list are separated by only a few points, so small shifts can reorder them. The table above reflects the 2025 data only.
Shop the Hope and Peace graphic t-shirts
After a data-heavy countdown, here are two graphic t-shirts with a more hopeful message.
Get this Hope graphic t-shirt on Amazon
Get this Peace graphic t-shirt on Amazon
Related reading: Countries With the Most Natural Disasters and What Are the Tallest Buildings in the World? For more data-driven countdowns, subscribe to the Mr Global Rankss YouTube channel.
Sources
- Security.org, Most Dangerous Cities: The Latest Rankings for the 50 Largest U.S. Cities (FBI Crime in the United States, 2025)
- Eufy, Most Dangerous Cities in the US Based on 2025 FBI Data


Leave a Reply